Does the Stock Market Do Better Under Democrats or Republicans?
I see stories in the newspapers and online about why the stock market wants President Obama to get reelected. I also see stories about why the stock market wants Mitt Romney to win the election. Theory tells us that the stock market will perform better when a Republican is sitting in the White House. This is because Republicans are “pro-Wall Street†in that they will keep the size of the government limited and will let the free market and capitalism do its thing (read: limit regulations). Democrats on the other hand, are seen as bad for the stock market because they want a bigger government and more regulations. Remember, this isn’t my view, just the stereotype and many of the stories I have recently read play right into these stereotypes.
Historical Performance
But what do the numbers actually say? If we look back at history, does it show that the stock market performs better when Republicans are in power and worse when Democrats are in power? The graph below is the annual market return by political party control that spans from 1937 through 2011. There are four options: a Republican President along with a Republican House and Senate (RRR); a Republican President and a split House and Senate (RSPLIT); a Democratic President, House and Senate (DDD); and a Democratic President and a split House and Senate (DSPLIT). The number in the parenthesis is the number of years each was in control.
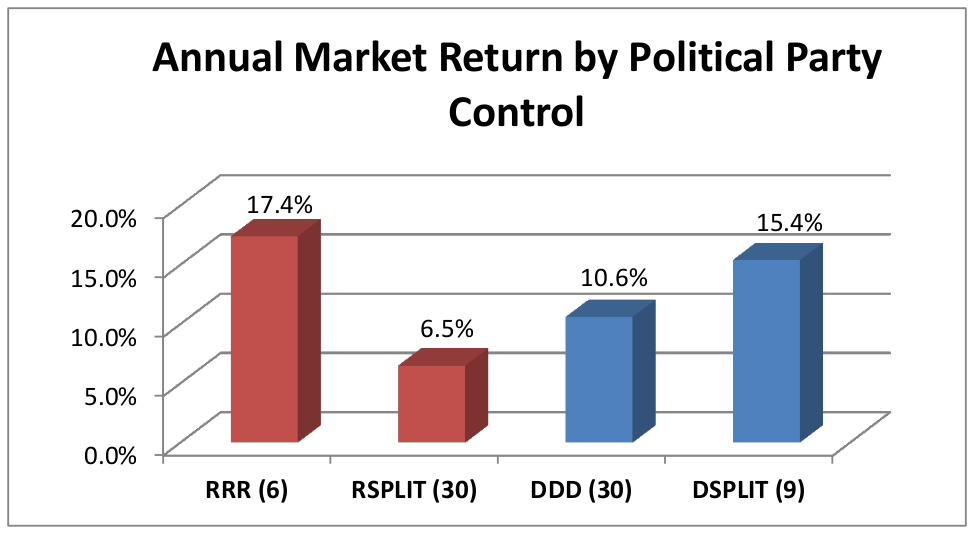
As you can see, the market returned the best during the time when Republicans controlled all three areas of the government returning 17.4%. When a Democrat was the President and had a split House and Senate, the market did almost as well, returning 15.4%.
What Does This Tell Us?
So the question is what exactly does this tell us? It tells us that it doesn’t matter who is in control. Over the long term, regardless of which political party is in control, the market has performed well. Over the short term, you can find times when the market did better or worse depending who was in control. But when it comes to investing, you need to focus on the long term, not the short term. Over the short term, there will always be volatility. Sometimes, this volatility can be extreme, as we have recently seen.
For me personally, I don’t tailor my investing based on who is in office. I don’t get excited when a Republican is President and I don’t get worried when a Democrat is President. I focus on the long term. I know that the market will rise and it will fall. I’m investing because I believe over the long term, the market will rise more than it falls.
Final Thoughts
No matter who wins the Presidency and the majority in the House and Senate tomorrow, you can rest assured that the market, over the long term, will be just fine.
What are your interpretations of the chart shown here? Does your investing strategy change based upon which political party is in control?


My investing strategy is not changed necessarily by who is in office, but my tax strategy does. This by extension changes my investment strategy. For example, If there is a DDD (as you listed), I will look at dumping my long term capitol assets to take the tax hit this year as there will be no chance in the bush era tax cuts will return in the near term. However if there is a RRR, I will maybe ride it out as the fund does well and is close to average, and I don’t have to pay any loading fees (as they were paid in 1982 when the fund was purchased).
I will post again as I have had a few more hours to think about a different response. I would like to point out that while the president, while an important person, is not the key to this situation. Congress is, as they make the laws (the president just vetoes or signs, unless over ruled). Look at the numbers from the congressional background info and you will see that when a republican held congress was had, 17.4% and 15.4% were the average returns. However when you had democratic held congresses, we had 10.6% and 6.5%.
The other thing I would like to point out, is that this information would be more fun to see how inflation (in terms of the CPI) comes into effect. Seeing how inflation falls with each of these years can provide more info as well. Guess if I get bored at home tonight I might just figure this out