Our Net Worth Increases: October 2007
Year to date our net worth has increased 19.3% through Oct 31, 2007. Our goal for 2007 is a 21.6% increase. Currently, it looks as if we will surpass our goal before year end.

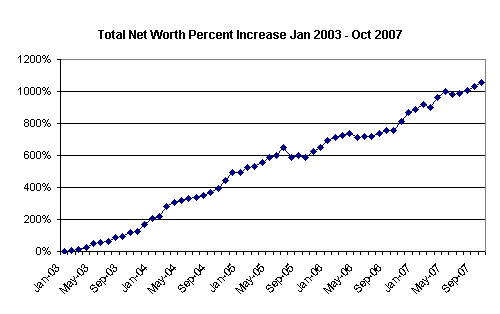
The total percent increase since we began “our dollar plan” is 1058%. A graph of the entire plan is below:

As you can see there are some points in time that stand out from the rest. In summer 2005 we began building our new house. We kept our condo while we built and used some of our taxable investments to fund the first part of the build, which explains the dip. In 2006 we both took off time after our son was born and only returned to work part-time for the remainder of the year. Read more about me.
About the plan
The starting point for the total percent increase graph is January 2003. It is somewhat arbitrary, because that was the year that I combined our Microsoft Money files into one as we were getting married. Instead of merging the files, I started fresh and imported the important accounts. There was data prior to 2003, but it is now in an outdated file that I cannot easily access.
I have already stated our 2007 goal of 21.6% increase for the year. See Our Dollar Plan for additional goals and more information on the plan.
About the graphs
I think I have come up with a decent way to illustrate our net worth increases without using dollars. The percentages should show the relative increases without distortion. You will notice the percentages are each month as of the beginning date, not the prior month.
However, without absolute dollars, you can use your imagination to determine if the starting point was $1 or $1 million. (I’ll give you a hint, it was somewhere in between.) One of the drawbacks to using percentages, is it is hard to determine if contributions still play a major role in the percentage increases.
I also refer to these graphs as net worth. They are only our investment accounts and exclude home equity and assets because I find those harder to track and much more illiquid in terms of converting them to an income stream in the future.
In addition, all of our investments do not report very timely. One account only reports earnings 6-8 weeks after a month end, so that account is as of September in the above graphs. That same account only reports contributions 4 months after year end, so every April I have to restate the prior year’s results. I base the graphs on what was last reported.
Stay tuned to see how we do on our dollar plan! I’ll do my best to provide regular updates.


