A year ago we looked into whether or not the Nest Learning Thermostat really saves money? [1] It was pretty early on after our installation, so I thought it would be appropriate to see how it’s doing now that we have a year of data to show and find out is the Nest thermostat worth it?
Next Thermostat Review of Savings
The Nest Learning Thermostat [2] is a programmable thermostat that programs itself by learning the temperatures you like and developing a schedule. Nest claims: “By programming itself, the Nest thermostat can save up to 20% on your heating and cooling bill.” How much are we saving?
We installed our Nest Learning Thermostat at the beginning of 2012. We purchased our 2nd generation Nest Thermostat on Amazon [2] for $256. In an effort to find out if the Nest really saves money, here’s my Nest Thermostat review of savings:
Natural Gas Use Comparison Before and After the Nest
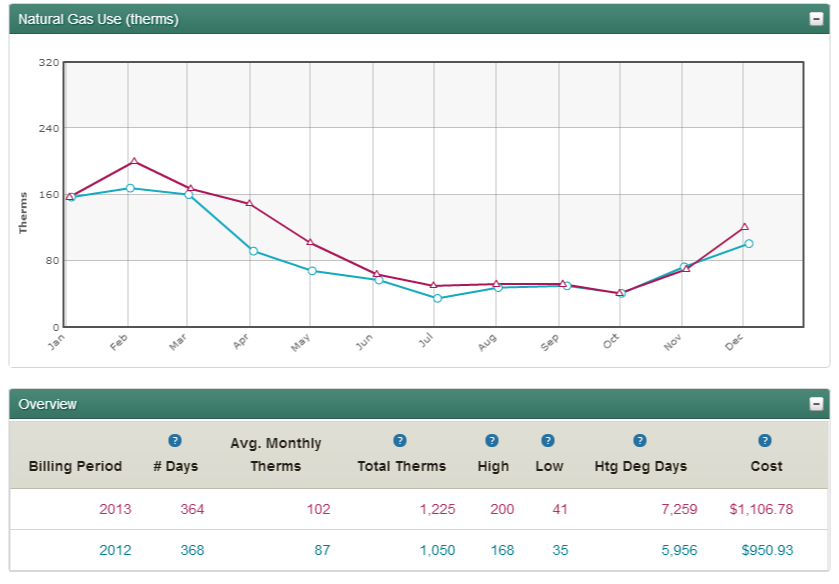
Here’s a look at our natural gas use for heating our home before and after we installed the Nest:
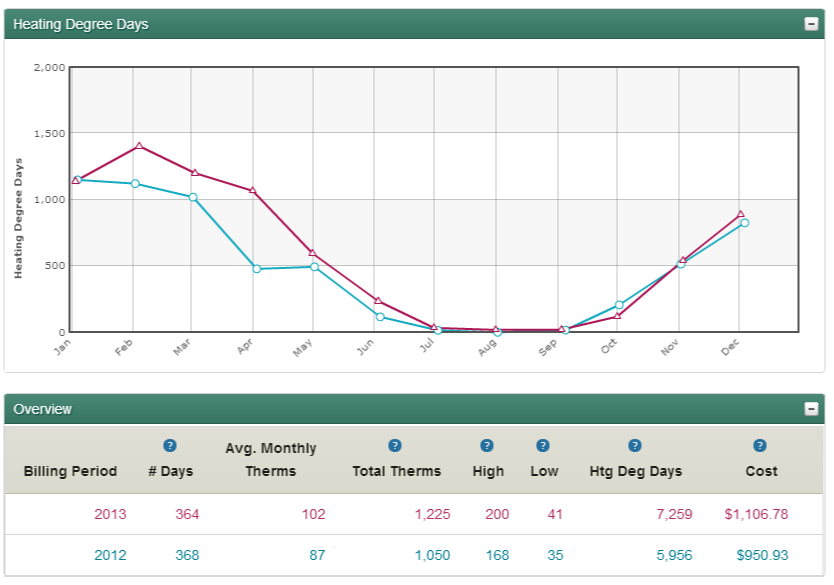
As you can see, our gas use went up, but we need to make an adjustment. We need to look a little further at heating degree days so we can compare the two years since the temperatures varied (and it was much colder during the winter in 2013). The heating degree days represent how cold it was (the higher the number, the colder it is). Here’s a look at the heating degree days for each year:
Then, to compare the year, we can calculate the Therms/Degree Day (natural gas used per degree day):
- 2012: 1050 therms; 5,956 heating degree days: 1050/ 5956 = .1763
- 2013: 1225 therms; 7,259 heating degree days: 1225/ 7259 = .1688
- Reduction in Therms/Degree Day: 4.25%
Overall, it appears that our natural gas used per degree day has gone down.
Electric Use Comparison Before and After the Nest
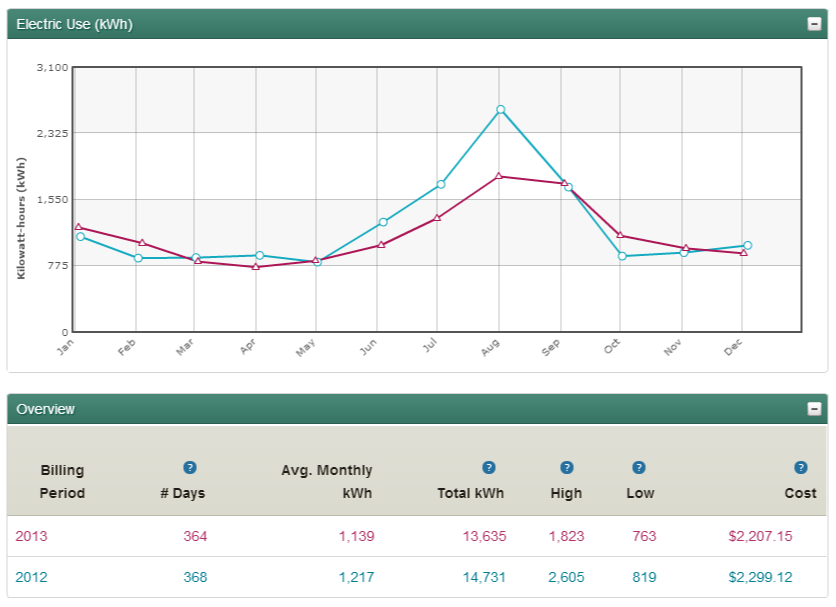
Now, onto the cooling months. Here’s a look at our electric use for cooling our home before and after we installed the Nest:
It appears our electric use went down, but again we need to adjust for the difference in temperatures. Unfortunately, our electric company doesn’t provide the cooling degree days like they do the heating degree days, so it took some additional work to see how the temperatures varied between the two years. Weather Underground [3] keeps the historical heating and cooling degree days, so I was able to calculate it on my own.
- 2012: Cooling Degree Days (base 65): 1070
- 2013: Cooling Degree Days (base 65): 709
Then I used the cooling degree days to calculate the kWh’s per degree day:
- 2012: 14,731 kwh / 1070 cdd = 13.767289
- 2013: 13,635 kwh / 709 cdd = 19.2313
However, I figured this wasn’t completely accurate since it doesn’t account for other factors besides just the cooling of the house. I found some helpful advice from the National Weather Service on Heating and Cooling Degree Days [4]. They state:
OTHER FACTORS : When comparing energy use, you should also consider other energy uses that are not impacted by weather such as lights, appliances, etc. You can estimate the energy used for these purposes by examining the energy used during temperate months such as May and October when little heating or cooling energy is used. The energy used during these periods reflect your base monthly consumption. Subtracting the base use from the total consumption during a winter month will yield an estimate of the energy used just for heating. It is also important to consider the usage period reflected in your energy bill. Your meter is probably not read on the first day of each month and therefore will not be for the same time period as the degree day totals. You can allow for this by comparing over a longer period, such as an entire heating season or several months.
Based on their ideas, I decided to find the kwh and cooling degree days for our four hottest summer months (May-August, which shows up on our June-Sept electric bills):
- Summer 2012: 7319 kwh / 968 cdd = 7.56
- Summer 2013: 5911 kwh / 605 cdd = 9.77
And then subtract the base using October as a base month. I averaged 980 (October 2013) and 930 (October 2012) to subtract a base of 955 kwh in each of the four summer months:
- Increase over Base Summer 2012: 7319 kwh – (4 * 955) / 968 cdd = 3.614
- Increase over Base Summer 2013: 5911 kwh – (4 * 955) / 605 cdd = 3.456
- Reduction in Adjusted kWh’s/Degree Day: 4.37%
Based on all the math, it looks like our electric used per degree day has gone down. However, after going through the calculations I’m not entirely sure how confident I am using some of the adjustments. After all, using such general estimations to calculate such precise numbers doesn’t feel very exact. Feel free to suggest improvements to the calculations if you see a better way to make it a fair comparison! And I wonder if I should go back and make the same adjustments for the natural gas used over the base to account for the use of our stove, grill and fireplace…
Next Steps
Based on the information above, it does look like the Nest [2] is probably saving us money. How much money did the Nest thermostat save us? It looks like we saved about 4% on both our heating and cooling in the first year.
It’s important to note that we only installed a Nest on one of our heating and cooling zones (we have dual zone). I think it might be worthwhile to purchase a second one for the top floor of our house and see if we see some additional savings. I’d also like to keep monitoring it and see how the numbers come in for the second year of use.
In addition, we’ve decided to revisit our solar panel [5] plans. We just had a solar company give us a quote and we’ll see where that leads us. Stay tuned for more on that!
Do you have a Nest thermostat [2]? Have you done the calculations to see if the Nest thermostat is saving you money?